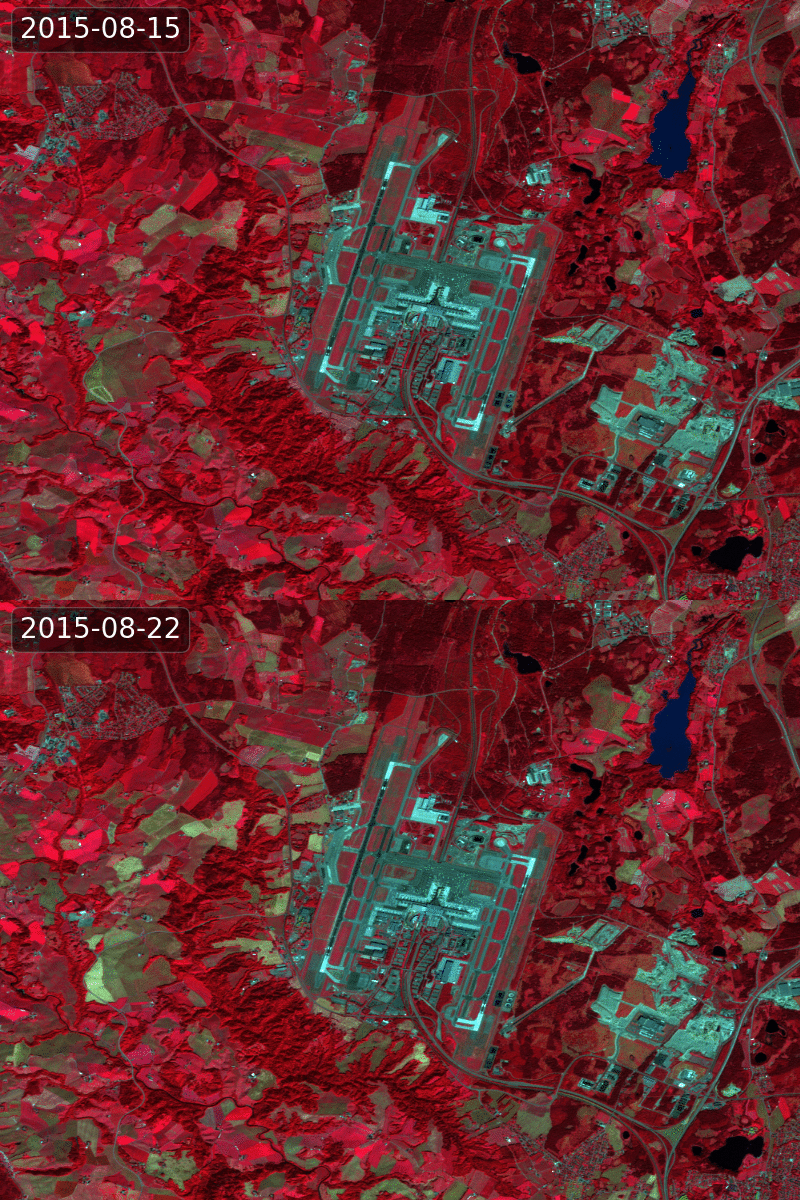
The Sentinel data are, among others, excellent for monitoring temporal change. The GIF above is an output from creating false colour vegetation RGB (Red, Green, Blue) composites of an area (covering Gardermoen airport outside Oslo) for looking at the temporal vegetation change.
In difference to a true colour vegetation composite having (red, green, blue) ( i.e. band B4, B3, B2 in Sentinel-2 bands) in the RGB composite, a false colour vegetation means that you shift the frequency bands in the RGB composite. In this case, we shift the RGB to consist of (near infrared, red, green) (i.e. B8, B4, B3). The spectral reflectance signature for vegetation is much higher in near infrared than for the visible frequencies due to the cellular structure in the leaves. Hence, the different shades of red indicates various types and conditions of the vegetation. Read more about spectral signature here.
On the following github gist, you find a Python script which generated the images in the GIF above in addition to calculate the Normalised Difference Vegetation Index:
http://nbviewer.jupyter.org/gist/hevgyrt/f141c985cc9d19aaaa0a4832ed80581


