Currently, the NBS offers to portals; One similar to the poral ESA is using and one that is integrated in satellittdata.no. In the latter portal, the Sentinel products dissiminated are stored in the NetCDF format which, among others, have support for OPeNDAP. We believe that through this approach the threshold is lowered for starting using satellite data. In addition, functionality like subsetting and regridding is possible. In this article we will show a couple of examples on the benefits of utilizing OPeNDAP when working on the the Sentinel-2 products produced in NetCDF.
OPeNDAP is an acronym for the Open-source Project for a Network Data Access Protocol. Using OPeNDAP, one disengages from the underlying file format and connects to a data stream. In practice, you don't need to have the file stored on your laptop in order to work on the data.
The first example shows how you can access all satellite products available through the NBS directly on your computer. The program is written in Python and uses the module siphon to connect to the THREDDS data server where you can select your product of interest. The script plots a single spectral band chosen from the drop down menu on top of a map.
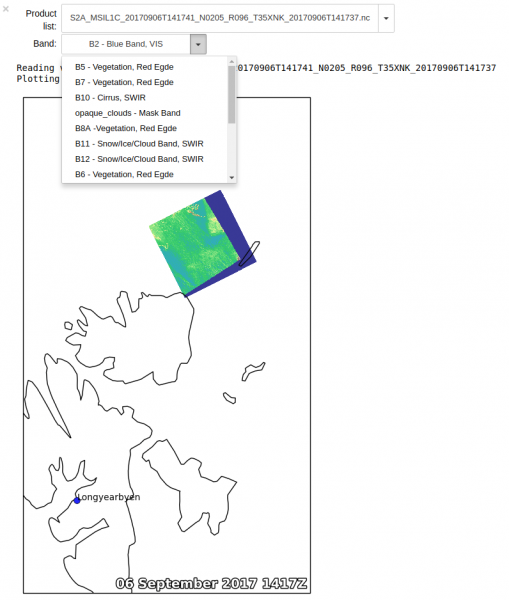
Source code can be found here.
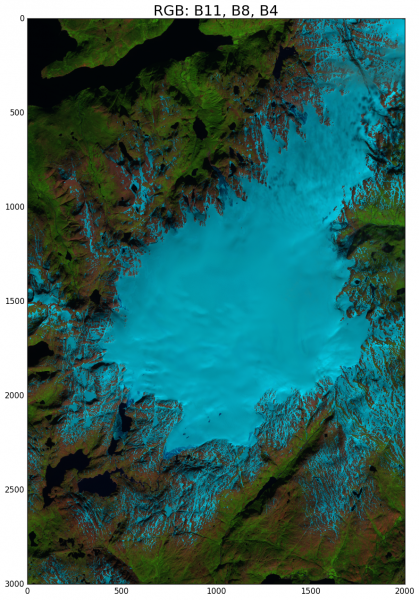
In the next example, the task is to do a semi-automatic detection of the glacier Folgefonna by menas of band maths and thresholding. Here, the data of interest is read directly through OPeNDAP from the netCDF4 Dataset module in Python. The Sentinel-2 satellites carries an optical instrument delivering spectral bands covering various domains in the electromagnetic spectrum. From these bands you could extract some of the physical properties from each of the frequencies and hence look at the sensitivity for e.g. snow and ice in this case. Due to storage considerations, the spectral bands are delivered in various spatial resolutions. In the NetCDF versions we have made all spectral bands available in the same spatial resoultion in order to make band combinations directly. The steps for extracting the outline of Folgefonna is as follows:
- Find a cloud free Sentinel-2 scene covering Folgefonna in satellittdata.no.
-
Connect to the data through OPeNDAP.
-
Perform a visual inspection of the various bands.
-
Compute a polygon around Folgefonna and store the data in a shape file.
Result:
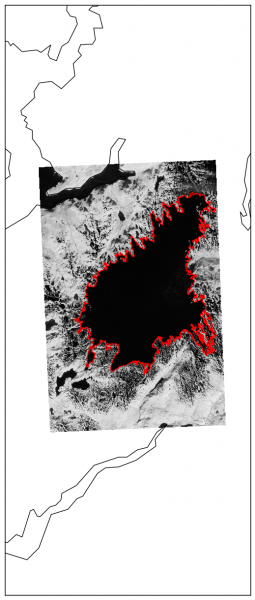
Complete source code can be found here.